Socket.io inspection techniques to simplify realtime app debugging
I recently built a poll application that updates a pie graph in realtime as users place their votes. When I first tested the application, the vote counts didn’t update as expected. As is often the case when debugging realtime web applications, it wasn’t immediately obvious whether the underlying glitch was on the client or the server. In many cases, the complexity of propagating events across that boundary creates subtle problems that are hard to spot. Compared to conventional HTTP API endpoints, WebSocket connections can seem terribly opaque.
During my recent struggle to vanquish the very vexing bug in my Socket.io vote application, I took a moment to meander through the landscape of WebSocket debugging tools. I discovered a few ways to lift the lid off a Socket.io connection and shed some light on the messages exchanged between client and server. With the benefit of my newfound tricks, I discovered that my application wasn’t picking up the updates on the client side due to a simple typo in the Socket.io message name. I quickly quashed the belligerent bug and got back to work. This blog post offers a quick look at a few of the techniques that I discovered along the way.
Inspect messages with the Chrome developer tools
Chrome’s built-in developer tool panel includes a lot of great features for troubleshooting frontend web applications. Although not easily discoverable, it has fairly rich support for inspecting WebSocket connection traffic.
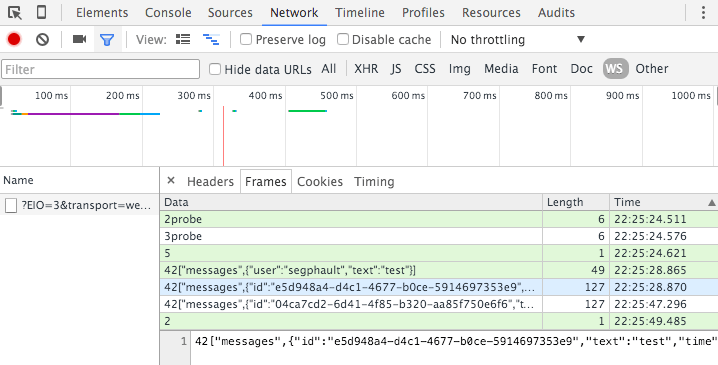
In the panel’s network tab, you can see a list of every HTTP request performed by the active web application. In the filter bar, click the WS label to limit the view to just the WebSocket connections. Select one of items in the list and navigate to the Frames tab in the content view.
The Frames tab shows a complete history of every message sent and received over the WebSocket connection. The incoming messages have a white background while outgoing messages are highlighted with a green background. Next to each item in the list, you can see the time at which the message was sent or received. You can select a message in the list to see the full text in the bottom frame. When I was debugging my poll application, the information in the frame panel helped me to establish that my WebSocket client was indeed receiving the messages even though my Socket.io client code wasn’t handling them.

Use Monitor.io to observe connections and replay messages
Monitor.io is an open source monitoring and debugging middleware component for Socket.io. When you add it to your Node.js application, it provides a monitoring interface that you can access remotely by opening a Telnet connection to a particular port.
It shows a list of active Socket.io client connections for your application. You can use the monitoring interface to broadcast messages–either globally or to a specific client. It also lets you forcibly disconnect a client, which is useful when you want to test how your frontend handles the connection dropping.
The list of active connections is a much nicer alternative to littering your code with a bunch of console log messages for connect/disconnect events. The monitor.io module includes a simple API that you can use to programmatically associate various bits of metadata with the Socket.io client connections. The metadata shows up in the dashboard, which can make it easier to distinguish various clients and see important live status information about each one. In a chat application, for example, you could have the monitor show the username and presence status of each client:

When I want to replay a particular message, I can copy the desired JSON from the Chrome network panel and paste it into the monitor’s broadcast feature. I can also modify the JSON or type in arbitrary values in order to see how my frontend handles the messages.
Get all the details with verbose Socket.io logging
The Socket.io client and server implementations both have fine-grained
logging with extremely detailed messages–all you have to do is turn
it on. To turn on Socket.io’s client-side logging, you can open the JavaScript
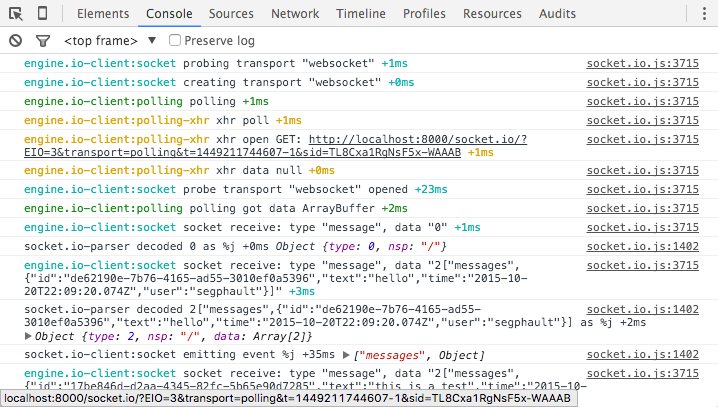
console in the Chrome developer tools and type localStorage.debug = '*'. With
that setting enabled, the Socket.io client library will fill your console with
log messages:

Because the setting is in local storage, it will persist across refreshes. You
can set the value to null if you want to turn off the debug messages. On the
server side, the equivalent is the DEBUG environment variable, which you can
set if you want the Node.js application to print logs to the console.
Note that the DEBUG environment variable is
used by a number of different node modules, not just Socket.io.
You can use scopes to configure what messages it displays.
Next steps
Armed with these essentials, you should be able to overcome the issues that you encounter while building applications with Socket.io. If you happen to be looking for a way to simplify the backend architecture of your realtime web application, consider trying RethinkDB. You can check out our ten-minute guide to get started.
Resources:
- Visit the official Socket.io website
- Learn more about Monitor.io
 Ryan Paul