
Data science on the iPad with RethinkDB and Pythonista
 Ryan Paul
Pythonista is an iOS application that brings Python development to Apple’s mobile devices. It includes a built-in Python runtime, an interactive REPL console, and a text editor with features like syntax highlighting and autocompletion. It also comes with its own canvas system and user interface toolkit, offering developers a way to build games and simple graphical applications.
In addition to the standard Python libraries, Pythonista bundles some useful extras that extend its functionality. For example, it comes with NumPy and matplotlib, which support scientific computing and advanced graphing. It also comes with a set of libraries that expose native platform and device capabilities, including geolocation and the system camera.
Used to its full potential, Pythonista is a surprisingly capable environment for mobile data science. I can use Pythonista on my iPad to crunch numbers at the coffee shop or on my living room couch. I couldn’t resist the temptation to add RethinkDB to the mix, giving me backend persistence and expressive queries.
Install the RethinkDB driver with Pipsta
With a little bit of tinkering, I figured out how to get RethinkDB’s
Python client driver into the Pythonista environment. Pythonista has its
own internal site-packages directory that you can use to store reusable
libraries. Of course, adding an entire framework to the built-in
site-packages directory by hand would prove prohibitively
time-consuming. Fortunately, a third-party script called
pipsta offers a lightweight pip implementation for
Pythonista. You can use the script to install libraries, including
RethinkDB’s Python driver, from the Python Package
Index.
I copied the script from GitHub and pasted it into a new file in
Pythonista’s site-packages directory. After adding the script, I typed
the following lines in the Pythonista REPL:
>>> import pipsta
>>> pipsta.pypi_install("rethinkdb")
The pipsta script automatically downloaded the RethinkDB package and
extracted the module into a pypi-modules subdirectory inside the
Pythonista directory structure. After installing the module, I decided to
move it directly to the site-packages directory so that I could import
it in the REPL or any Pythonista script without altering the import path.
Use RethinkDB in Pythonista
You can access RethinkDB in Pythonista on iOS in exactly the same manner that you would access RethinkDB in any other Python environment. I have a RethinkDB server running on my local network, so all I have to do is specify its internal network IP when I set up a connection in Pythonista:
import rethinkdb as r

conn = r.connect("192.168.0.10", 28015)
print r.db("rethinkdb").table_list().run(conn)
conn.close()
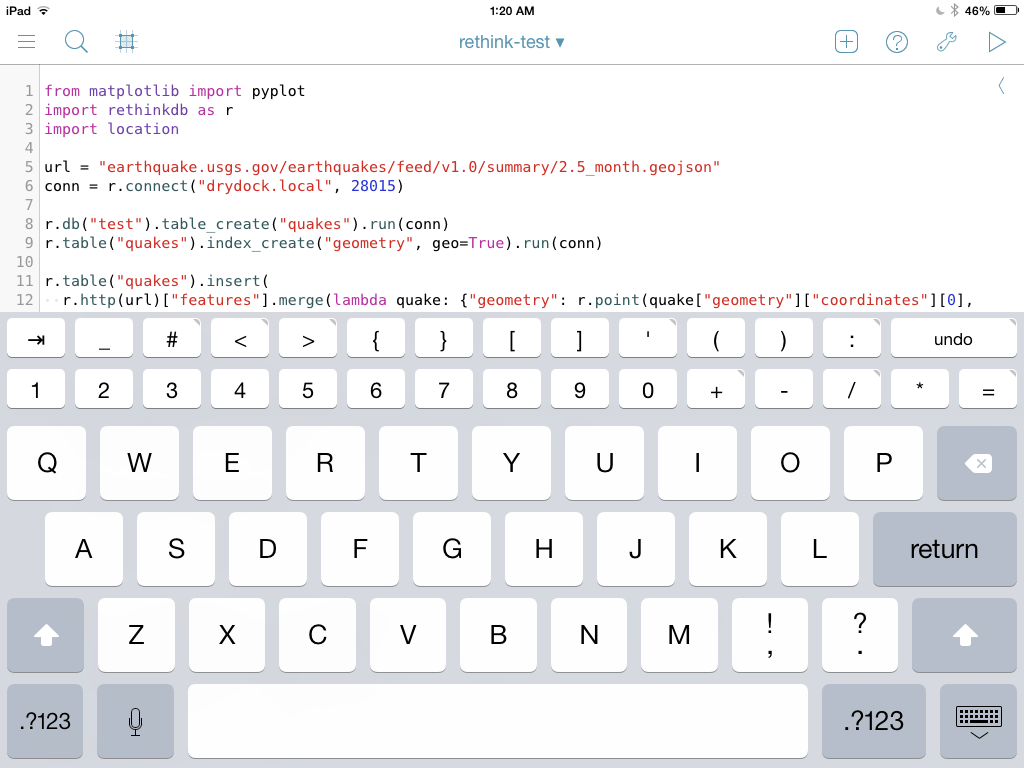
Now I’m going try a more substantive example, one that uses the same USGS
earthquake data that I used last year to demonstrate RethinkDB’s
geospatial features. I’m going to create a table to store
the earthquakes, set up a geospatial index, and then use the r.http
command to fetch the data. Next, I’ll use a simple merge transformation
to turn the epicenter coordinates for each earthquake into an actual
r.point object:
import rethinkdb as r

url = "earthquake.usgs.gov/earthquakes/feed/v1.0/summary/2.5_month.geojson"
conn = r.connect("192.168.0.10", 28015)

r.db("test").table_create("quakes").run(conn)
r.table("quakes").index_create("geometry", geo=True).run(conn)

r.table("quakes").insert(
  r.http(url)["features"].merge(lambda quake: {"geometry": r.point(
    quake["geometry"]["coordinates"][0],
    quake["geometry"]["coordinates"][1])})).run(conn)
Now that I have the earthquake records in a table, I’m going to use
Pythonista’s geolocation module with the r.get_intersecting command to
find all of the earthquakes that occurred within 100 miles of the user:
import rethinkdb as r
import location

conn = r.connect("192.168.0.10", 28015)

location.start_updates()

where = location.get_location()
nearby_quakes = r.table("quakes").get_intersecting(
    r.circle([where["longitude"], where["latitude"]], 100, unit="mi"),
    index="geometry").run(conn)

for quake in nearby_quakes:
    print quake["properties"]["title"]

location.stop_updates()
Pythonista’s built-in location module provides an abstraction layer over
the platform’s built-in geolocation APIs, making it easy to access the
user’s GPS coordinates. To activate location tracking, call
location.start_updates(). After tracking begins, call
location.get_location() to get the user’s coordinates.
In the example above, I pass the user’s coordinates into the
get_intersecting command and then display the output in the console.
Any content that you print to stdout in Pythonista will display in the
REPL console. You can switch there now to see the output of the script.
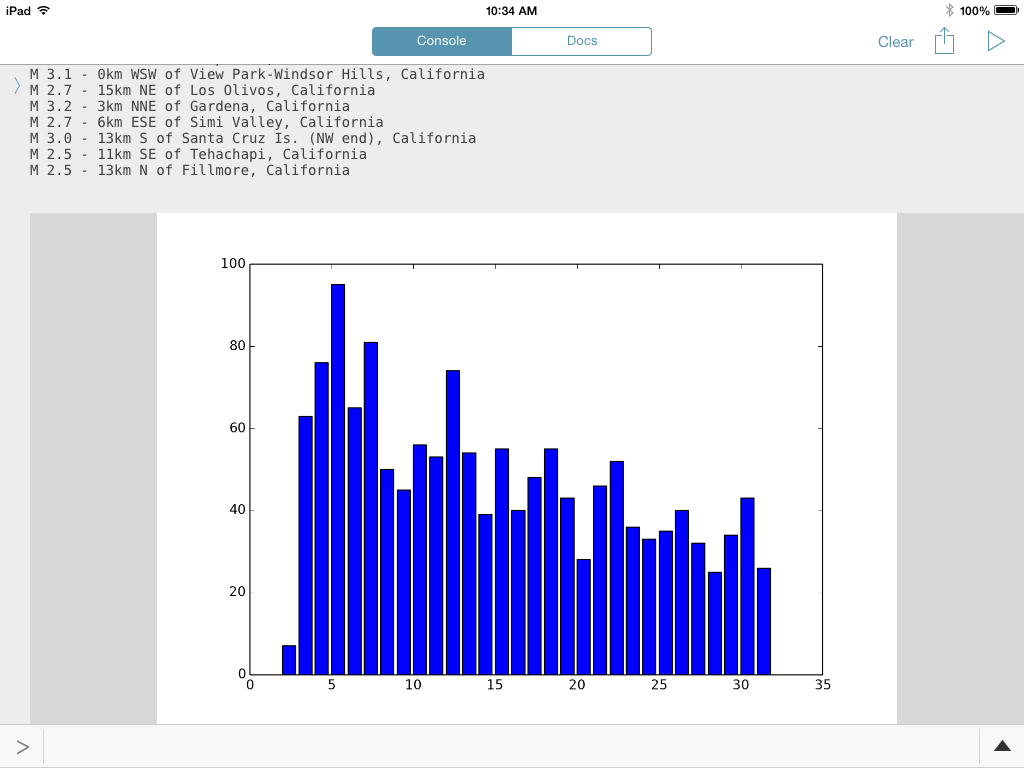
Generate graphs with RethinkDB and matplotlib
As I previously mentioned, Pythonista includes matplotlib and NumPy right out of the box. I use RethinkDB with matplotlib to generate quick data visualizations.
In the following example, I use a complex ReQL query to compute the number of earthquakes that occur on each day of the month. I pass the output to matplotlib, which generates a bar graph:
from maplotlib import pyplot
import rethinkdb as r

conn = r.connect("192.168.0.10", 28015)

quakes = r.db("quake").table("quakes") \
	.merge({"date": r.epoch_time(r.row["properties"]["time"] / 1000).date()}) \
	.filter(r.row["date"].month() == r.now().month()) \
	.group(r.row["date"].day()).count() \
	.ungroup().order_by(r.row["group"]) \
	.do([r.row["group"], r.row["reduction"]]).run(conn)

print quakes
pyplot.bar(quakes[0], quakes[1])
pyplot.show()
When I call the show method, Pythonista automatically displays the
resulting image in its REPL console alongside the other application
output. This makes it pretty easy to iterate on a script, experimenting
with different chart styles and approaches to visualizing data.
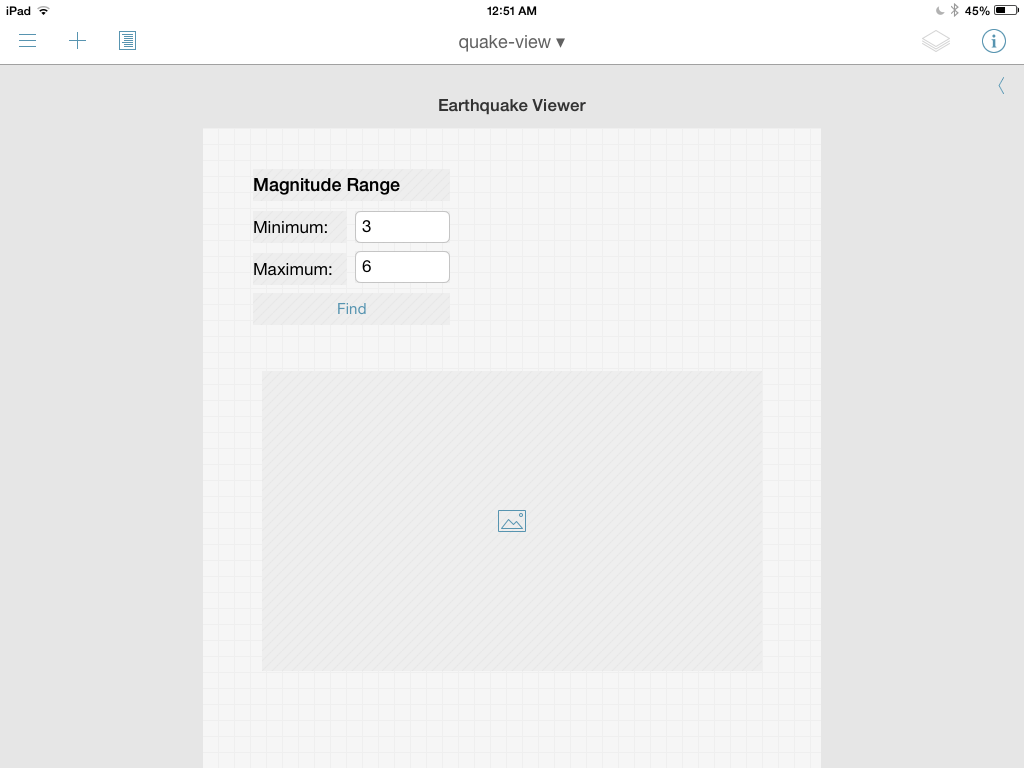
Build interactive user interfaces in Pythonista
Pythonista provides a simple user interface toolkit that developers can use to build graphical frontends for their scripts. The toolkit includes a handful of user interface controls, a layout system, and support for triggering callbacks for user interface events.
Pythonista offers a built-in visual editor that you can use to create views and manage layouts. I used the visual editor to create a simple graphical frontend for the previous matplotlib example.
I made a form with two text inputs that lets the user specify a minimum and maximum earthquake magnitude. When the user hits a button, the application will perform the query, but filter for only the earthquakes that fall within the specified boundaries. It generates a bar graph, which it displays to users in a image viewer control in the user interface. This is what the user interface form looks like in Pythonista’s visual view designer:
I used the visual designer to set up an action for the “Find” button. When
a user presses the button, the application will execute a function called
find. The following is the source code for the application:
from matplotlib import pyplot
from cStringIO import StringIO
import rethinkdb as r
import ui

conn = r.connect("192.168.0.10", 28015)

def find_quakes(min, max):
    return r.db("quake").table("quakes") \
        .merge({"date": r.epoch_time(r.row["properties"]["time"] / 1000).date()}) \
        .filter(r.row["date"].month() == r.now().month()
            and r.row["properties"]["mag"] >= min
            and r.row["properties"]["mag"] <= max) \
        .group(r.row["date"].day()).count() \
        .ungroup().order_by(r.row["group"]) \
        .do([r.row["group"], r.row["reduction"]]).run(conn)

def find(sender):
    min = float(view["text_min"].text)
    max = float(view["text_max"].text)

    quakes = find_quakes(min, max)
    sio = StringIO()

    pyplot.clf()
    pyplot.bar(quakes[0], quakes[1])
    pyplot.savefig(sio)

    view["image_result"].image = ui.Image.from_data(sio.getvalue())

view = ui.load_view()
view.present()
The ui.load_view method instantiates the view and all of the embedded
controls. You can use Python’s index sugar to access a control by name.
For example, the code above uses view["text_min"].text to extract the
contents of the text box named text_min.
When the application actives the find function, it will retrieve the
minimum and maximum earthquake magnitude so that it can incorporate those
values into the ReQL query. When it uses matplotlib to produce the bar
chart, it saves the resulting binary image content into a StringIO
instance that I can pass to ui.Image.from_data to display the image in
the user interface.
Next steps
Although this earthquake example is somewhat contrived, it should give you a sense of what you can build with Pythonista. You can make user interfaces that let the user specify the input parameters for a query. You can take advantage of matplotlib or the UI toolkit to display rich query results. You can also take advantage of Pythonista’s REPL to perform interactive experiments with data and data visualization. It’s a great a way to explore your RethinkDB data while you are on the go.
If you want to enable remote access so that you can use your home RethinkDB database from the coffee shop, be sure to take reasonable security precautions. I use a VPN to connect my mobile device to my home network so that I can securely access my database without exposing the port to the public internet.
Want to try using RethinkDB with Pythonista yourself? Install RethinkDB today and check out our 10-minute quickstart guide.
Resources: