A realtime RethinkDB cluster monitoring app with live graphs
 Ryan Paul
When we announced the RethinkDB 1.16 last week, we showed how you can use changefeeds with the new ReQL-based admin API to monitor the status of a RethinkDB cluster. In this blog post, I’m going to expand on that example and show you how I used the same underlying RethinkDB features to build a realtime cluster monitoring dashboard with live graphs—much like the dashboard built into the RethinkDB web UI.
Query the stats table
RethinkDB 1.16 introduced a new set of system tables that you can use to monitor and configure a RethinkDB cluster. You can interact the system tables using ReQL queries, just like you would with any other RethinkDB table.
The built-in stats table contains statistics about the current activity of
the cluster. You can query the stats table to see, for example, the current
number of queries performed per second on individual tables and servers or the
entire cluster. To get just the cluster-wide statistics, I use the following
query:
r.db("rethinkdb").table("stats").filter(r.row("id")(0).eq("cluster"))
To get a live feed of the data, I simply chain the changes command to the end
of the query. The changefeed will continuously emit updates with the latest
statistical data.
Stream changes to your frontend with Socket.io
I used Node.js and Socket.io to create a web-based dashboard with a live view of the cluster statistics. The frontend is built with Polymer The backend attaches a changefeed to the cluster monitoring query and emits all of the updates through Socket.io:
var express = require("express");
var sockio = require("socket.io");
var r = require("rethinkdb");

var app = express();
app.use(express.static(__dirname + "/public"));

var io = sockio.listen(app.listen(8099), {log: false});
console.log("Server started on port " + 8099);

r.connect({db: "rethinkdb"}).then(function(c) {
  r.table("stats").filter(r.row("id")(0).eq("cluster")).changes().run(c)
    .then(function(cursor) {
      cursor.each(function(err, item) {
        io.sockets.emit("stats", item);
      });
    });
});
The frontend is built with the data binding system from Polymer, an open source Web Components framework. The Socket.io client catches all of the updates from the server and uses data bindings to display the data to the end user:
<template id="cluster" is="auto-binding">
<ul class="stats">
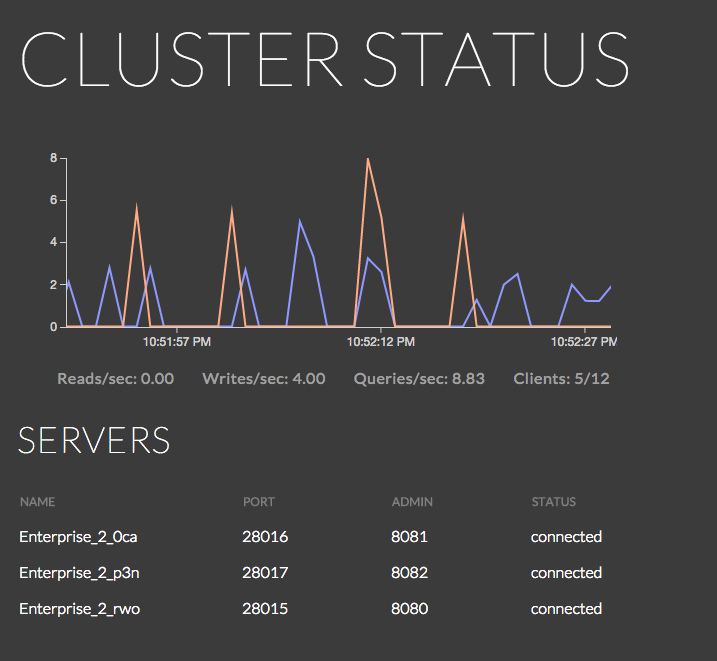
<li>Reads/sec: {{stats.read_docs_per_sec | toFixed(2)}}</li>
<li>Writes/sec: {{stats.written_docs_per_sec | toFixed(2)}}</li>
<li>Queries/sec: {{stats.queries_per_sec | toFixed(2)}}</li>
<li>Clients: {{stats.clients_active}}/{{stats.client_connections}}</li>
</ul>
</template>
<script>
var cluster = document.querySelector("#cluster");
cluster.toFixed = function(value, precision) {
return Number(value).toFixed(precision);
};
var socket = io.connect();
socket.on("stats", function(data) {
cluster.stats = data.new_val.query_engine;
});
</script>
Polymer’s data bindings operate on plain JavaScript objects, so all I have to do is take the latest data from Socket.io and assign it to a property on the template. All of the data bindings that access the property will update automatically every time the value changes.
Display realtime data with live graphs
I used an open source library called Epoch to display live graphs of the realtime data. Epoch is built on top of the D3 visualization framework, but it abstracts away a lot of D3’s underlying complexity. In situations where you just want a simple realtime chart, Epoch can save you some time. I added the following line of HTML at the location in the page where I want the live graph:
<div class="epoch category40" id="chart" style="width: 600px; height: 200px;"></div>
I also added some JavaScript code to initialize the graph and add data nodes every time Socket.io picks up new stats from the server:
function timestamp() { return (new Date).getTime() / 1000; }

var chart = $("#chart").epoch({
  type: "time.line",
  axes: ["left", "bottom"],
  data: [
    {label: "Writes", values: [{time: timestamp(), y: 0}]},
    {label: "Reads", values: [{time: timestamp(), y: 0}]}
  ]
});

var socket = io.connect();
socket.on("stats", function(data) {
  cluster.stats = data.new_val.query_engine;
  chart.push([
    { time: timestamp(), y: cluster.stats.written_docs_per_sec },
    { time: timestamp(), y: cluster.stats.read_docs_per_sec}
  ]);
});
Each point in the graph has a Y axis value and a UNIX timestamp that correlates with its position on the X axis. The Epoch library and D3 take care of everything else, including interpolating the points, setting up the axis ticks, and animating the graph as time passes.
The graph has two lines, so that it can simultaneously display the volume of
read and write operations. When initially configuring Epoch, you can tell it to
have multiple data lines by setting up the data property as an array with
multiple objects. When I use the push method to add a new point, I pass in an
array with one object for each line.
Display server status information
In addition to a live graph of cluster statistics, I also want the dashboard to
show the status of every server in the cluster. RethinkDB has a system table
called server_status that you can query to obtain that information. I
attached a changefeed to a simple query on the server_status table in order
to get a live stream of changes:
r.connect({db: "rethinkdb"}).then(function(c) {
  r.table("server_status").changes().run(c)
    .then(function(cursor) {
      cursor.each(function(err, item) {
        io.sockets.emit("servers", item);
      });
    });
});
I also need to propagate the initial state of the table to the frontend
whenever a user loads the page. I wired up a callback that triggers every time
the application receives a new connection from a Socket.io client. In the
callback, the application connects to the database, fetches the current
contents of the server_status table, and transmits the data to the user:
io.sockets.on("connection", function(socket) {
  var conn;
  r.connect({db: "rethinkdb"}).then(function(c) {
    conn = c;
    return r.table("server_status").run(conn);
  })
  .then(function(cursor) { return cursor.toArray(); })
  .then(function(result) {
    socket.emit("servers", result);
  })
  .error(function(err) { console.log("Failure:", err); })
  .finally(function() {
    if (conn)
      conn.close();
  });
});
On the frontend, I can use that initial data to populate the table and then modify it as needed when further updates are available:
socket.on("servers", function(data) {
  if (data.length)
    return cluster.servers = data;

  if (!data.old_val)
    return cluster.servers.push(data.new_val);

  for (var s in cluster.servers)
    if (cluster.servers[s].id == data.old_val.id)
      cluster.servers[s] = data.new_val;
});
In this particular situation, updating the changing values is a little tricky. In most cases, an update will represent a change in status for an existing server that is already in the list. When that occurs, I have to iterate through the list, find the record with the matching id, and replace it with the new data.
I also get notifications, however, when the user adds or removes a server from
the cluster. If the record’s old_val property is empty, I can assume that
it’s a new server, which means that all I have to do is append it to the list.
I could also similarly remove records when I get an update with an empty
new_val property, but I chose not to bother because it’s easier to have the
template conditionally hide empty records.
I added the following markup to my HTML template to display the list of servers. Notice the use of conditional expressions to hide empty records and highlight disconnected servers:
<table>
  <template repeat="{{server in servers}}">
    <tr style="{{ !server.status && 'display: none' }}"
        class="{{ server.status != 'connected' && 'fail' }}">
      <td>{{server.name}}</td>
      <td>{{server.network.reql_port}}</td>
      <td>{{server.network.http_admin_port}}</td>
      <td>{{server.status}}</td>
    </tr>
  </template>
</table>
As you can see, it doesn’t take much code to stream realtime RethinkDB table updates to a frontend web client. It’s worth noting that the techniques used in this article are broadly applicable to data stored in RethinkDB, not just the special system tables. If you want to add live graphs and realtime streaming to your RethinkDB application, it’s quite easy to add changefeeds to your queries and use Socket.io (or an equivalent library) to get the data to your frontend.
Want to try it yourself? Install RethinkDB and check out the thirty-second quick start guide.
Resources:
- Full source code of the cluster monitoring demo on GitHub
- Intro to RethinkDB’s realtime capabilities
- Documentation for RethinkDB’s system tables
- Epoch realtime charting library