More on alignment, ext2, and partitioning on SSDs
 RethinkDB Team
In our previous post we touched on alignment issues on solid-state drives. Our test read different-sized blocks from various random points on a raw device, aligned to a particular boundary. Today we’d like to expand on that work, and discuss how other factors affect SSD read performance. In addition to testing different block sizes and alignment boundaries, we tested two other factors: how the drive is partitioned, and what filesystem is used.
We decided to test different partitioning schemes because they can profoundly affect alignment. By default, today’s partitioning tools use 63 sectors per track. Each sector is 512B, so a sector contains 32256B. Unfortunately this value is not 4K aligned (32256 is not divisible by 4096). Since the first partition starts on the second track, the default partition is not 4K aligned. We wanted to test whether this affects performance. We used three partitioning schemes: no partition (reading from a raw block device), default partitioning scheme used by fdisk (not 4K aligned), and a 4K aligned partitioning scheme (we tell fdisk to start on sector 128 instead).
In addition to testing partitioning schemes, we wanted to test how adding a filesystem on top of the device affects performance. We tested reading from the device (or partition) directly, vs. reading a 1GB file from ext2 (created with standard options).
For each of these configurations we ran random reads for block sizes from 512B to 4096B (at 512B increments), and 512B to 4096B aligned boundaries (also at 512B increments). That’s 3 * 2 * 8 * 8 = 384 different combinations, so it’s not immediately clear how to visualize the data. The first thing we did, was to plot six different graphs that visualize block size vs. alignment boundary (one graph for each partitioning and file system combination). We hoped that it would let us pick out some interesting trends:
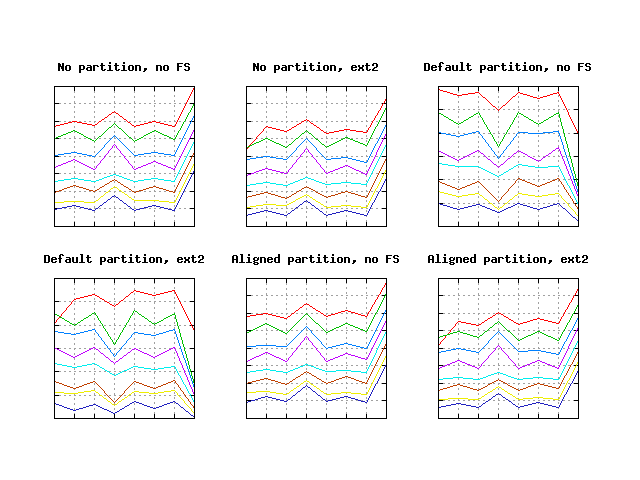
On these graphs the red line represents a 512B block size, the blue line represents a 4096 block size, and the other colors represent block sizes in between. The x-axis is the alignment boundary, and the y-axis is performance.
Glancing at these graphs we can see some clear trends.
- The red line is always highest (except for a couple of small anomalies), which means reading 512B chunks is always fastest on every setup.
- The graphs that display runs that ran on unpartitioned devices, and the graphs that display runs on aligned partitioned devices are roughly the same.
- Default partition graphs look inverted from their counterparts.
From this, we can reach two important conclusions:
- For drilldown visualizations, we don’t need to worry about the block size since curves that represent different block sizes look the same. We’ll focus on 512B block sizes.
- Graph inversion for unaligned partitions is shifted by 512B, which makes perfect sense: when we add an extra 512 to 32256, we get to a 4KB boundary on the drive ((63 * 512 + 512) / 4096 = 8).
Let’s take a closer look at the drilled down visualization:
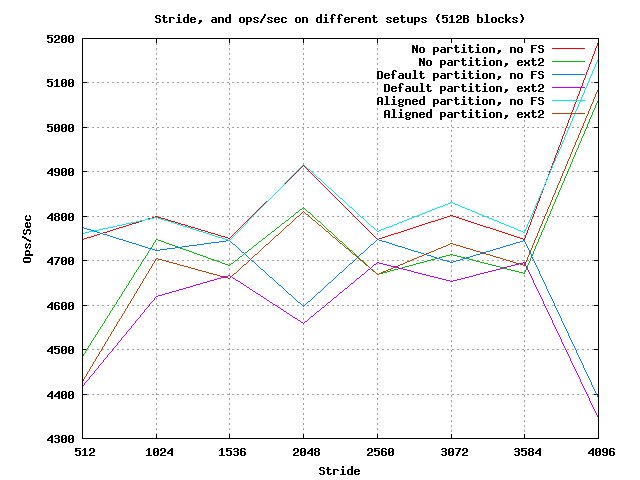
From this graph we can deduce a few interesting things:
- Partition misalignment can cause a 15% drop in performance.
- Reading from the raw device with no file system is occasionally a little faster than reading from an aligned partition with no file system - two fastest modes of operation.
- Reading from ext2 causes a 2% drop in performance compared to reading from the raw device.