Make beautiful charts with RethinkDB queries and Charted.co
 Ryan Paul
While building applications with RethinkDB, I often find cases where I want to be able to produce simple visualizations to help me better understand my data. Ideally, I’d like to take the output of a simple query and see what it looks like in a graph with as little work as possible. A new project recently introduced by the developers at Medium offers a compelling solution.
Medium’s product science team built a lightweight web application called Charted that makes it easy for users to generate and share graphs. As input, the user provides a URL that points to CSV data. Charted processes the data and produces simple graphs with a clean and elegant design. No configuration is needed, though it allows the user to choose between bar and line formats and customize certain aspects of the output.
Charted is built on D3, a popular frontend JavaScript library that is widely used for data visualization. Simplicity is the chief advantage that Charted offers over rolling your own D3-based data visualizations by hand. Medium runs a hosted instance at Charted.co that anyone can use to publish and share graphs. You can also download the Charted source code from Github and run your own installation.
In order to use Charted with RethinkDB, you will need to convert the output of the desired query into CSV format and publish it at a URL. Fortunately, there are a number of libraries that make it very easy to perform the necessary conversion. In this tutorial, I will show you how I used the Python-based CSVKit framework with Flask to expose the output of a RethinkDB query in a form that I could pass to Charted.
Prepare your data with CSVKit
CSVKit is an open source toolkit for manipulating CSV content. It’s primarily intended for use at the command line, but you can also consume it as a library in a Python script. It has a wide range of features, but we are primarily interested in using its built-in support for converting JSON to CSV.
You can import the json2csv function from the csvkit.convert.js module. The
function expects to receive a file-like object, which means that you will need
to wrap the content in StringIO if you would like to use a string instead of
a file:
from csvkit.convert.js import json2csv

data = """[
  {"name": "Scott Summers", "codename": "Cyclops"},
  {"name": "Hank McCoy", "codename": "Best"},
  {"name": "Warren Worthington", "codename": "Angel"}
]"""

print json2csv(StringIO.StringIO(data))
If you run the code above, it will correlate the matching keys and display a comma-separated table of the values:
name,codename
Scott Summers,Cyclops
Hank McCoy,Best
Warren Worthington,Angel
Not bad so far, right? The conversion process is relatively straightforward. If you have nested objects, it will simply ignore them—it only operates on the top-level keys.
Transform data from RethinkDB
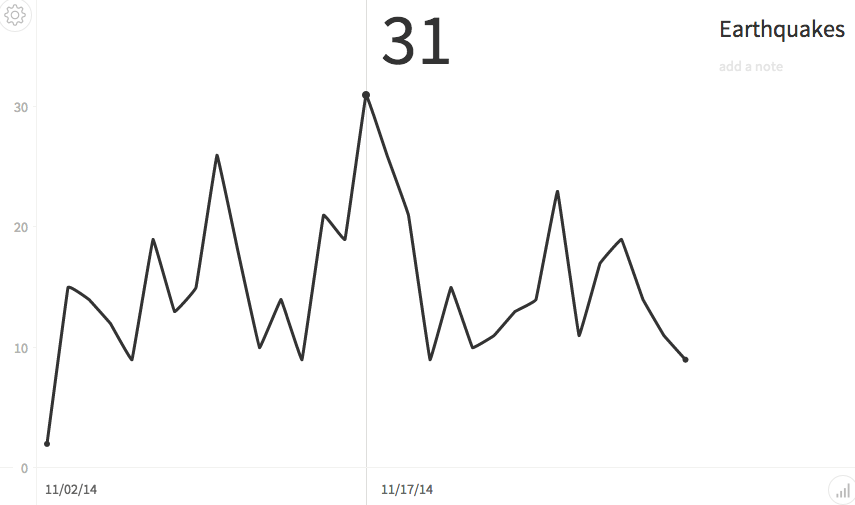
Now that you know how to convert JSON to CSV, the next step is applying the function to the output of your desired query. For the purposes of this tutorial, I’m going to use a feed of earthquake data from the USGS. As you might recall, I used that same data a few months ago in a tutorial that introduced geospatial queries.
In this case, I want to get the total number of earthquakes for each given day so that I will be able to plot it on a graph. Start by creating the table and loading the earthquake feed into the database:
c = r.connect()
r.db_create("quake").run(c)
r.db("quake").table_create("quakes").run(c)

url = "earthquake.usgs.gov/earthquakes/feed/v1.0/summary/4.5_month.geojson"
r.table("quakes").insert(r.http(url)["features"]).run(c)
To retrieve the relevant data, start by using the group command to organize
the earthquakes by date. Next, append the ungroup command to chain additional
operations to the grouped output. Finally, use the merge command to add a
property that contains a total count of the records for each individual group:
output = r.db("quake").table("quakes") \
    .group(r.epoch_time(r.row["properties"]["time"] / 1000).date()) \
    .ungroup().merge({"count": r.row["reduction"].count()}).run(conn)
The group command will create a property called reduction that contains all
of the values for each group. To get the total number of items for the group,
you can simply call the count method on the array stored in reduction. The
USGS feed uses high-precision timestamps, so you have to divide the value of
the time property by 1000 to get the number of seconds before applying the
epoch_time command.
There are a few minor wrinkles that you have to sort out before you convert the output to CSV. The group keys are date objects, which you can’t really use for graphing. You must convert those timestamps to simple date strings that are suitable for use in the graph. The order of the keys is also important, because Charted will automatically use the first column as the x-axis in its graphs.
In order to specify the key order and format the timestamps, you will need to
iterate over each item in the result set and create an OrderedDict that
contains all of the values:
data = json.dumps([OrderedDict([
    ["date", item["group"].strftime("%D")],
    ["count", item["count"]]]) for item in output])

print json2csv(StringIO.StringIO(data))
Serve the output
In order to get the data into Charted, you will need to serve the generated CSV content through a public URL. For the purposes of this tutorial, I chose to accomplish that with Flask, a simple Python library for building server-side web applications.
In a Flask application, you use a Python decorator to associate a function with a URL route. I chose to create two routes, one that exposes the content in JSON format and one that exposes it in CSV format. The latter simply wraps the output of the former:
@app.route("/quakes")
def quakesJSON():
    conn = r.connect()
    output = r.db("quake").table("quakes") \
        .group(r.epoch_time(r.row["properties"]["time"] / 1000).date()) \
        .ungroup().merge({"count": r.row["reduction"].count()}).run(conn)

    conn.close();
    return json.dumps([OrderedDict([
        ["date", item["group"].strftime("%D")],
        ["count", item["count"]]]) for item in output])

@app.route("/quakes/csv")
def quakesCSV():
    return json2csv(StringIO.StringIO(quakesJSON()))
Now that you have a running server that outputs your data set in CSV format, you can take the URL and provide it to Charted. If you intend to use the public instance of Charted that is hosted at Charted.co, you will need to make sure that your Flask application server is publicly accessible. You might want to consider using a tool like ngrok to make a Flask application running on your local system accessible to the rest of the Internet. If you don’t want to publicly expose your data, you could also optionally run your own local instance of Charted.
You can find a complete 50-line example by visiting this gist on GitHub. Install RethinkDB to try it for yourself.
For additional information, you can refer to:
- Medium’s Charted usage instructions
- The official CSVKit documentation
- The RethinkDB 10-minute guide
- The Charted source code on GitHub